Instrument Details displays in-depth data and a customizable chart for a selected instrument. You can get to an Instrument Details page by tapping a market data line for an instrument.
To view Instrument Details
Tap a financial instrument line from any tool that includes them (Portfolio, Watchlist, Scanner etc) to display abbreviated Instrument Details.
View Instrument Details to the right of the data list.
Other tasks you can perform in Instrument Details:
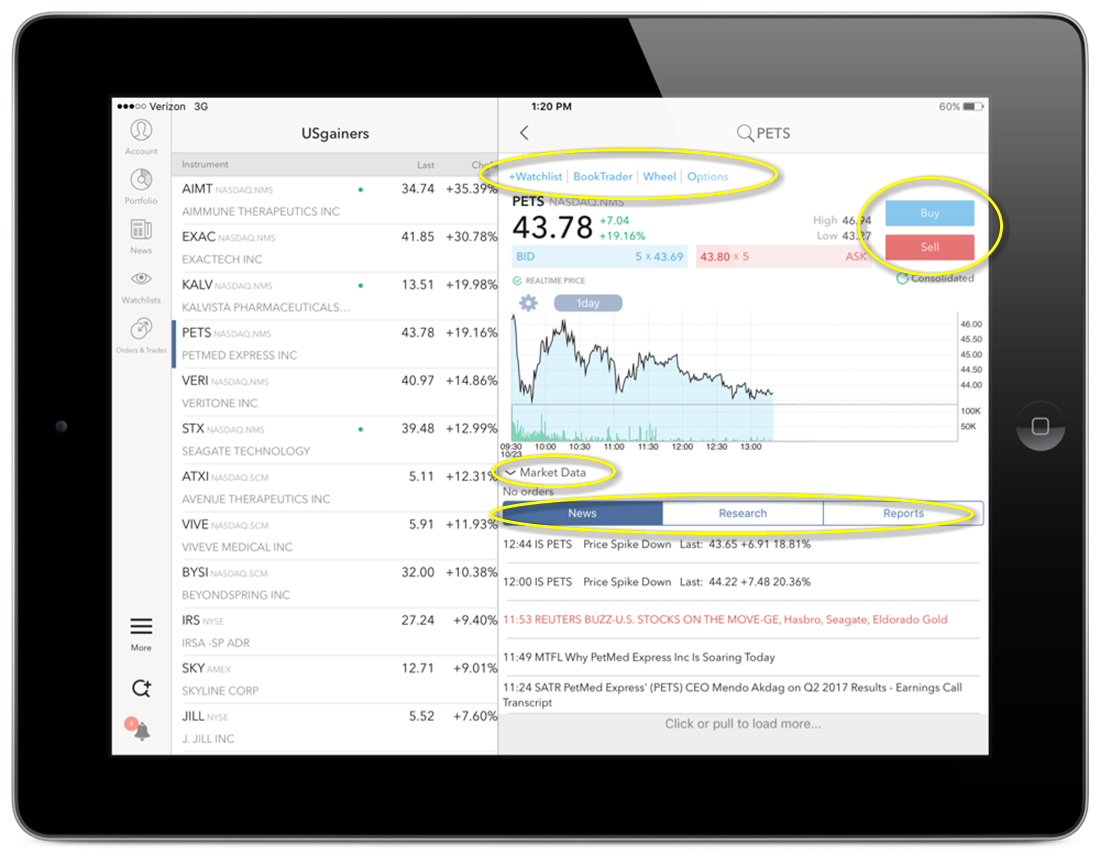
Expand sections below the chart to view relevant data:
Tap Market Data (below the chart)to expand, and view the open, close, 52-week high, 52-week low, volume, EPS, P/E, Dividends and Dividend Yield.
Tap Position (only visible if applicable) to view your position in the instrument.