View chains on any stock or futures instrument that has options, including index options. Enable Strategy Builder to create and trade complex, multi-leg strategies. Use the Spread Template to
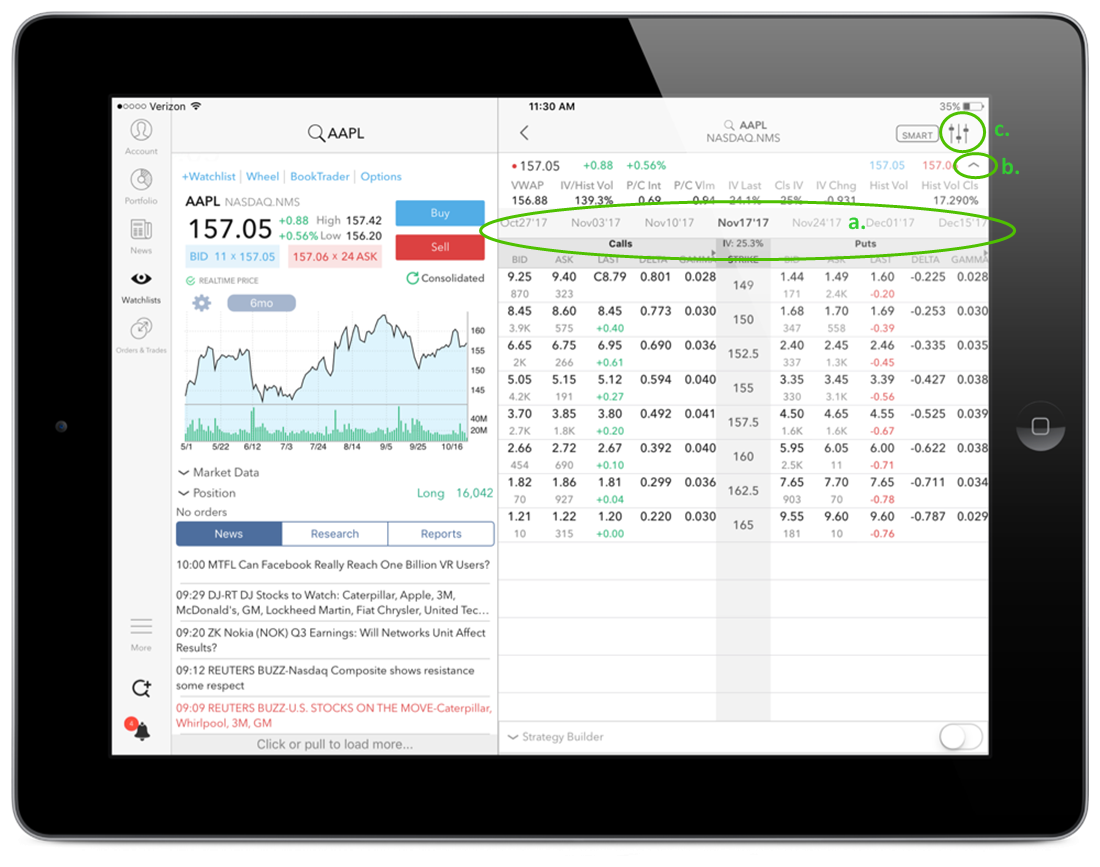
View chains by expiry by tapping an expiration date. The selected expiry is highlighted.
See additional market data by tapping the "down" arrow to the right of the data line. Hide by tapping the "up" arrow.
Configure chains display (# of strikes, standard deviation, time period, whether or not to show days to last trading day, trading class) by tapping the three vertical "adjustment" lines in the top right corner next to the destination. Tap Manage Columns to add the Greeks and other columns.
The Implied Volatility shown at the top of the Strike column (IV: 25.3% in the below image) reflects the implied volatility for the selected expiry.