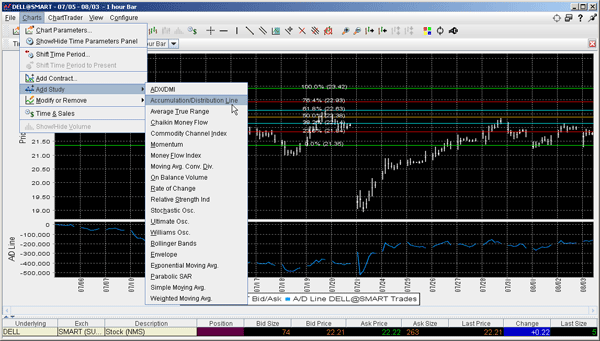
Apply an Accumulation/Distribution Line
This indicator attempts to quantify the flow of money into and out of a given stock. In theory, knowing this money/volume flow may help you to recognize an upcoming move in the stock price.
To apply an Accumulation/Distribution line
On the Charts menu select Add Study.
From the list of study indicators, select Accumulation/Distribution Line.
Select a contract (if your chart includes multiple contracts) and define the source, then click OK.