Pivot points are used to project potential support and resistance levels. Main time periods are daily, weekly and monthly.
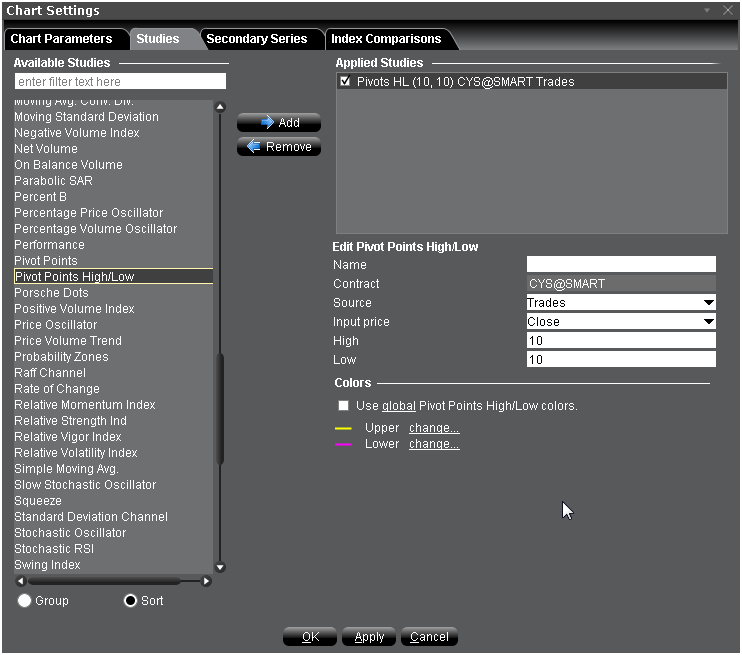
To apply a Pivot Points High/Low Indicator
Once the study is defined, you can elect to uncheck/check to remove and add the study to your chart.
Note: It is possible that in some cases, for example when the closing price is near the high or low and there is a wide range, the S1 or R1 value will be above the PP.