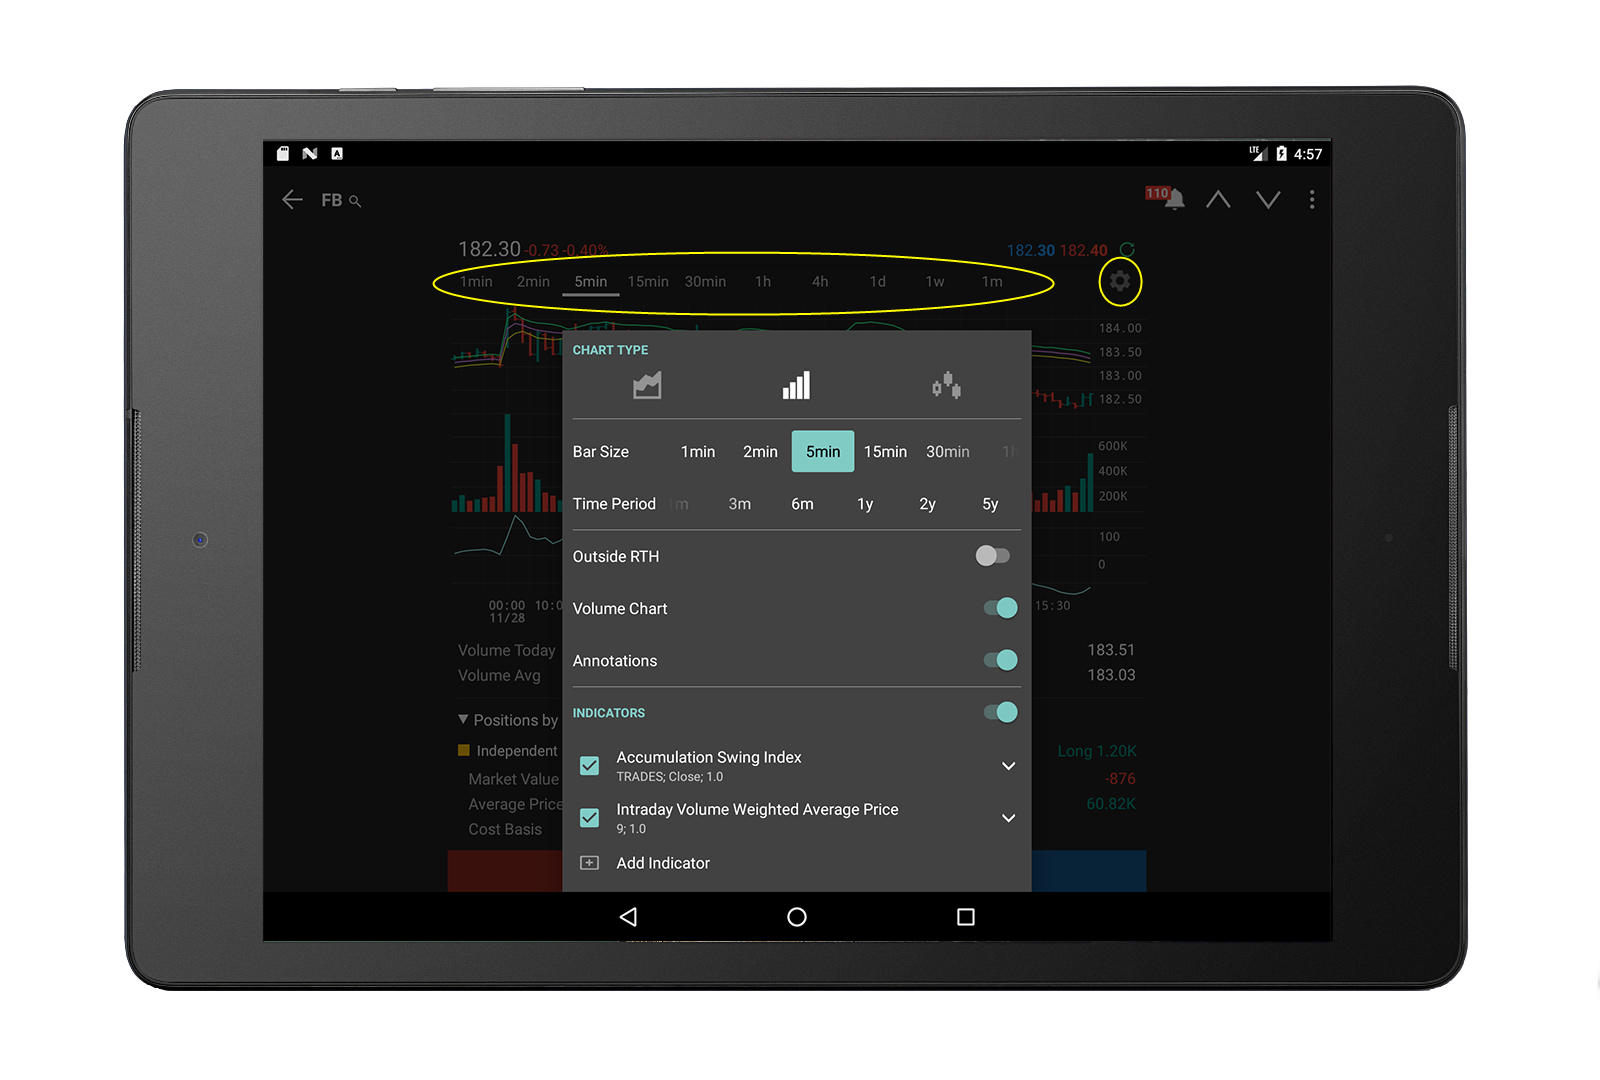
View a small chart on an expanded quote line and a larger version on the Instrument Details page.
To use charts
From a Watchlist, Scanner, or Portfolio screen, tap a financial instrument to see a thumbnail chart as part of the expanded quote line.
Within the chart:
Tap a time period along the top of the chart to change the chart's time period.
Tap the settings Gear icon to modify all chart settings, including chart type and bar size, time period, Outside RTH trades, volume chart, Annotations (dividends and other events) and Indicators. To add an indicator, use the toggle switch to enable. Tap Add Indicator and then select to add them to your chart.
Note: Indicators you have applied to a chart are listed in the Indicators box. When turned on, they are automatically applied to all charts. Use the indicator toggle switch within any chart to remove an indicator from that chart, without deleting it.